Humans Process Visual Data Better
In the name of history, we are recreating the results of the research conducted by Thermopylae Sciences and Technology in 2015. They were experts in web-based geospatial capabilities, mobile software frameworks and applications, situational awareness, and cloud computing.
Organizations of all stripes, shapes and sizes are drowning in a tidal wave of data.
When you look at just how much big data has expanded, it can be alarming. For example, Google receives more than 2 million search queries every minute. On a larger scale, humans are currently generating an estimated 2.5 quintillion bytes of data every single day.
Here’s one way to look at this stat: 90 percent of the world’s data has been created in the last two years alone. The rise of a multitude of sources – from social media to the web to the expanded use of sensors – is making it difficult for organizations to make sense of the data. When this occurs, it is nearly impossible to translate the information into something actionable that provides a tangible return-on-investment (ROI).
Thankfully, the rise of visual data displays or data visualization is helping to meet this need.
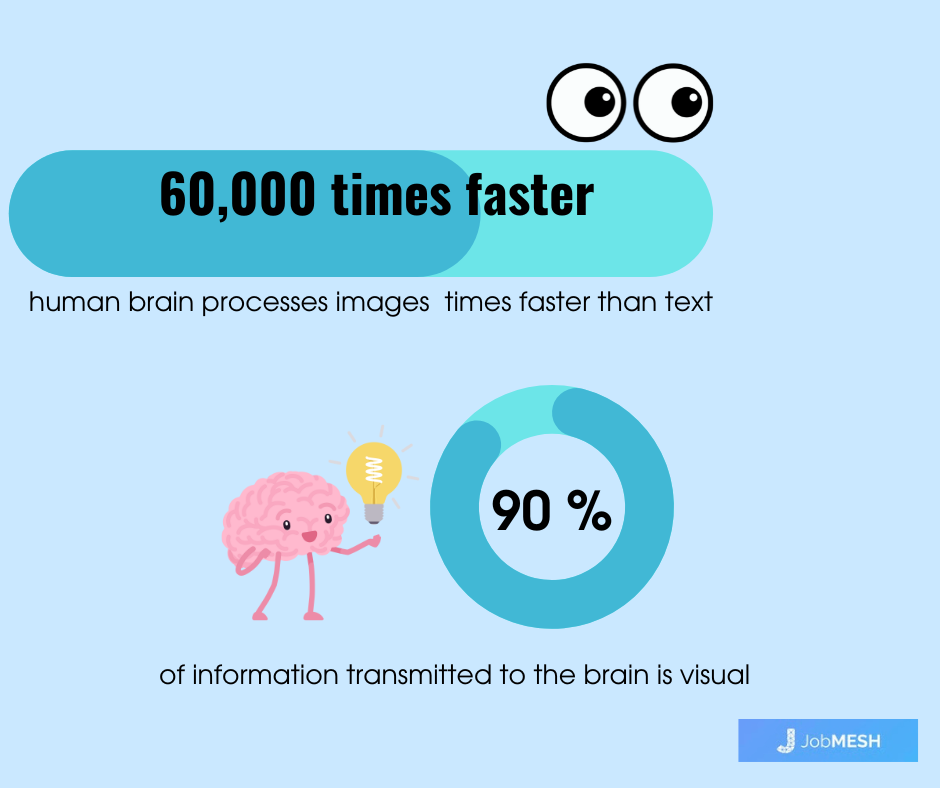
Visualization works from a human perspective because we respond to and process visual data better than any other type of data. In fact, the human brain processes images 60,000 times faster than text, and 90 percent of information transmitted to the brain is visual. Since we are visual by nature, we can use this skill to enhance data processing and organizational effectiveness.
Businesses deal with data that is highly complex, with multidimensional relationships across many different, massive data sets. These could include sales, site locations, demographics, roads, and promotions – each as their own set of complex data.
The good news is that all of this data is geospatial and can be presented in visual ways. Data from various departments can be freed from their respective silos and create more rapid and accurate decision-making. In addition, visual information makes it easier to collaborate, and generate new ideas that impact organizational performance.
Human beings are visual creatures. As such, the time is right for organizations to implement tnew solutions for leveraging data visualization and unlock their true potential to meet mission and business goals.